
Silver Price Today: March 21, 2026
Silver maintains its position at $67.95 per ounce during Friday morning trading, establishing what technical analysts view as a pivotal testing ground for near-term price direction.
The precious metal has consolidated within a narrow range over recent sessions, building energy for what could prove a decisive move in either direction.
Spot silver mirrors the futures price at $67.95, reflecting synchronized trading across physical and paper markets. This alignment often precedes significant volatility as institutional flows converge around key technical thresholds.
The current price action occurs against a backdrop of measured Federal Reserve commentary, with Fed Chair Jerome Powell’s recent statements emphasizing data-dependent policy decisions.
March’s consumer price index data, showing a 2.8% year-over-year increase, has reinforced expectations for continued monetary policy recalibration.
Technical Picture: Support, Resistance & Key Thresholds
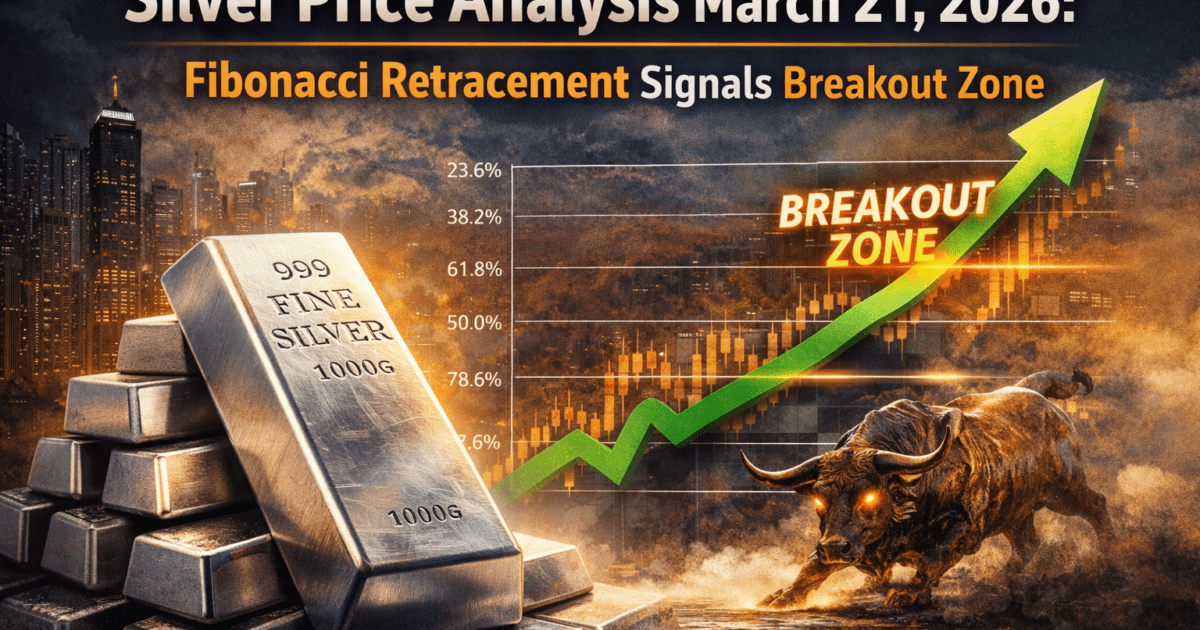
Fibonacci retracement analysis reveals silver’s current position directly testing the 61.8% retracement level from February’s rally high to early March lows. This golden ratio level at $67.90 has acted as both support and resistance over the past week, creating a critical decision point for momentum traders.
The 14-period Relative Strength Index registers 52.4, positioning silver in neutral territory with room for movement in either direction. RSI momentum has been building from oversold conditions two weeks ago, suggesting underlying buying interest remains intact despite recent consolidation.
MACD indicators show a bullish crossover formation developing, with the signal line preparing to cross above the MACD line around the zero threshold. This technical setup often precedes sustained upward moves when confirmed by volume expansion.
Bollinger Bands have contracted significantly around the $67.95 price level, with the upper band at $69.20 and lower band at $66.70. This compression typically signals an impending volatility expansion, though direction remains dependent on catalyst emergence.
Key resistance emerges at the 78.6% Fibonacci level near $69.35, coinciding with previous swing highs from mid-February. A sustained break above this zone could target the psychological $70 level, where call option interest has concentrated.
Primary support aligns with the 50% retracement at $66.15, backed by the 200-period moving average currently rising through $65.80. These levels represent logical profit-taking zones for long positions established during March’s early weakness.
Why Is Silver Moving? Technical Momentum Building Steam
Silver’s current price action reflects technical positioning rather than fundamental catalyst response, with algorithmic trading systems responding to Fibonacci level interactions. The convergence of multiple technical indicators around current prices has attracted systematic buying from momentum-following strategies.
Industrial demand patterns continue supporting silver’s technical setup, particularly from solar panel manufacturing and electronic component production.
The International Energy Agency’s latest renewable energy outlook projected continued silver consumption growth through 2026, providing fundamental underpinning for technical breakout scenarios.
Currency market dynamics add another layer to silver’s technical picture, with the Dollar Index trading around 102.5 creating a neutral backdrop for precious metals. Neither significant dollar strength nor weakness emerges as a dominant technical factor at current levels.
Options market activity shows elevated call interest around $70 strikes expiring in April, while put protection clusters around $65 levels. This positioning suggests traders and investors expect resolution of current technical patterns within established ranges.
Investor Question: What Happens to Silver Next?
Technical analysis suggests silver approaches a resolution phase for its recent consolidation pattern, with Fibonacci retracement levels providing the primary framework for directional moves. A sustained break above $68.50 could trigger momentum buying toward the 78.6% retracement near $69.35.
Conversely, failure to hold the 61.8% Fibonacci support around $67.90 might precipitate selling toward the 50% retracement at $66.15. Volume expansion will likely determine which scenario unfolds, with current trading remaining relatively subdued.
The approaching monthly options expiration adds another technical consideration, potentially creating volatility around key strike prices. Market makers’ delta hedging activities could amplify moves once technical levels break decisively.
Weekly closing levels become particularly significant given the Fibonacci retracement framework currently governing price action. A weekly close above $68.20 would strengthen the bullish technical setup, while closes below $67.50 might encourage additional profit-taking.
Short-Term Outlook & Conclusion
Silver’s technical analysis reveals a market poised for directional resolution, with Fibonacci retracement levels, RSI momentum, and MACD crossover patterns aligning around current prices. The 61.8% retracement level at $67.90 serves as the primary battleground for near-term direction.
Bullish technical scenarios target initial resistance at $69.35, corresponding to the 78.6% Fibonacci level and previous swing highs. Extended strength could challenge the psychological $70 threshold, where options positioning suggests increased volatility potential.
Bearish technical outcomes would likely test support at $66.15, aligned with the 50% retracement level and rising 200-period moving average. This zone represents a logical area for renewed buying interest should current consolidation resolve lower.
The silver forecast hinges on technical catalyst emergence, with volume expansion needed to confirm directional moves beyond current Fibonacci-defined ranges. Traders and investors await resolution of compressed Bollinger Band conditions and MACD crossover confirmation.
Analysis incorporates spot silver pricing data, Fibonacci retracement calculations, and technical indicator readings from major commodity trading platforms. Federal Reserve policy references draw from recent FOMC meeting transcripts and Chair Powell’s congressional testimony.
Not Financial Advice: This article is for informational purposes only. Silver investments carry significant risk. Consult a licensed financial advisor before making investment decisions.