

Bitcoin started at zero. Literally nothing. No exchange, no market, no price tag. Today, it trades above $80,000 and has touched $126,000 at its peak. That journey, stretching from a cryptography mailing list in 2008 to front pages of the Wall Street Journal, is one of the most extraordinary stories in financial history.
This guide walks through Bitcoin’s price history year by year, covering the exact numbers, the events that moved markets, and the patterns every serious investor should understand before putting money into BTC.
Why Bitcoin’s Price Is So Hard to Predict
Before diving into the numbers, it helps to understand what actually moves Bitcoin. Most assets trade on earnings, dividends, or economic output. Bitcoin has none of those. Its price comes down to a few core forces.
Supply is fixed at 21 million coins. That ceiling never changes, and roughly every four years, the rate of new supply gets cut in half through an event called the halving. When demand grows against a shrinking supply increase, prices tend to rise. This is the single most important structural force in Bitcoin’s price history.
Beyond supply, regulatory decisions move markets fast. A government banning crypto exchanges can wipe 30% off the price in a day. An ETF approval can add the same in a week. Institutional adoption, macroeconomic conditions like inflation and interest rates, and plain market sentiment round out the picture. With that context, here is what actually happened, year by year.
Bitcoin Price History: Year by Year Breakdown
2009: The Genesis Block and No Market Price
Satoshi Nakamoto mined the first Bitcoin block on January 3, 2009. Inside that block, he embedded a newspaper headline referencing a government bailout of failing banks, a pointed commentary on why Bitcoin existed in the first place.
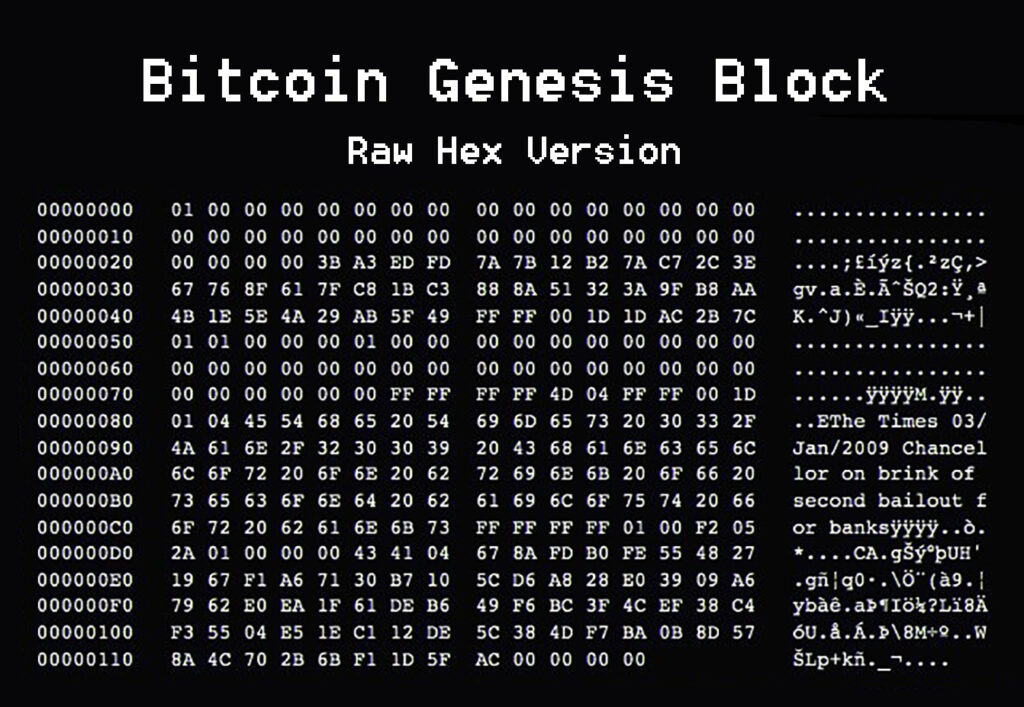
For the entirety of 2009, Bitcoin had no market price. No exchanges existed. The only way to acquire Bitcoin was to mine it yourself or receive it directly from another person. The lowest price ever recorded in Bitcoin history was $0.00099 per coin, noted on October 12, 2009, when a developer sold 5,050 bitcoins for $5.02 via PayPal. That transaction gives us the first real data point: a fraction of a cent per coin.
2010: Two Pizzas, 10,000 BTC
The most famous trade in crypto history happened on May 22, 2010. Laszlo Hanyecz posted on the BitcoinTalk forum offering 10,000 BTC for two large pizzas. Someone took the deal. Bitcoin’s highest price for the entire year of 2010 was just $0.39, and the coin never crossed $1 during that period.

That pizza trade, now celebrated annually as Bitcoin Pizza Day, is a reminder of how far the asset has come. At Bitcoin’s 2025 peak, those 10,000 coins would have been worth over $1.2 billion.
2011: First Dollar, First Crash
February 2011 marked the moment Bitcoin crossed $1 for the first time. It felt like a milestone then. Within months, it would feel like the floor.
By June 2011, Bitcoin’s price had hit nearly $30, a seemingly unimaginable rise from just months before. The coin spent the remainder of 2011 dwindling to as low as $2, before finishing the year at $4.70. The early pattern was already establishing itself: dramatic rises, dramatic crashes, and a floor higher than where the coin started.
2012: First Halving, Quiet Consolidation
Bitcoin had a relatively flat 2012, trading within a narrow range around $5 for the first half of the year. It reached its yearly peak at the end of December, hitting $13.45.
The critical event came in November. Bitcoin underwent its first ever halving, which dropped the block reward from 50 BTC to 25 BTC. Few people understood the significance at the time. Within a year, they would.
WordPress became one of the first major companies to accept Bitcoin payments, a signal that the currency had uses beyond speculation and experiment.
2013: $1,000 for the First Time
This was the year ordinary people first started hearing about Bitcoin, often in alarming contexts. From $13.00 at the beginning of the year, Bitcoin hit nearly $250 in April, cooled off, then experienced another rapid appreciation to over $1,100 in December.
The April spike was partly tied to the banking crisis in Cyprus, where depositors feared their savings would be seized. Some moved money into Bitcoin as an alternative. The December surge pushed the coin past $1,000 for the first time in history, a barrier that felt psychological and permanent. Then China’s central bank moved, warning financial institutions away from Bitcoin, and the price collapsed back toward $500 by year end. The volatility was extreme, but the direction over the full year was clearly up.

2014: Mt. Gox and a Year of Damage Control
No year tested Bitcoin’s believers quite like 2014. Mt. Gox, at the time the largest Bitcoin exchange in the world, announced in February that approximately 850,000 BTC had been stolen through a series of hacks. The exchange filed for bankruptcy. After the Mt. Gox collapse, Bitcoin regained its losses and reached new all-time highs within 2 to 3 years, a pattern it would repeat after every major crash.
In the short term though, the damage was severe. Bitcoin fell from around $850 to close the year near $320. The mainstream narrative shifted from excitement to skepticism.
2015: Rebuilding in the Background
2015 does not make for exciting charts. Bitcoin traded mostly between $200 and $500, which felt catastrophic to anyone who had bought near the 2013 peak. But the infrastructure being built during this period mattered enormously.
Institutional players began looking into crypto custody solutions, futures products launched, and the ecosystem grew more polished. Bitcoin was no longer just the domain of hobbyists and early adopters. Coinbase received regulatory licenses across 25 US states. Venture capital flowing into Bitcoin infrastructure surpassed $1 billion for the first time. The foundation for the next run was being quietly laid.
2016: Second Halving Sets the Stage
Bitcoin entered 2016 around $430 and spent most of the year grinding upward without dramatic headlines. The key event came in July: the second halving, which cut the block reward from 25 BTC to 12.5 BTC. By December, Bitcoin was closing in on $1,000 again.
The pattern from 2012 was repeating. A halving arrives, supply slows, and roughly 12 to 18 months later, prices find a new gear.
2017: The Mania Year
If 2013 introduced Bitcoin to curious observers, 2017 introduced it to everyone. The price opened the year near $1,000 and by December was briefly touching $20,000. That 20x gain in a single calendar year brought in millions of new investors, most of whom had never traded any asset before.
Japan officially recognized Bitcoin as legal tender in April. Ethereum and a wave of new cryptocurrencies competed for attention. ICOs raised billions. The mainstream media ran daily coverage.
On December 11, Bitcoin futures trading opened at the Chicago Board Options Exchange. Bitcoin rallied 12% that day, though its run came to an end just five days later. The high of $19,000 would not be broken for almost three more years.
2018: Gravity Takes Over
What followed 2017’s euphoria was entirely predictable in retrospect and deeply painful in the moment. Bitcoin’s year-on-year return for 2018 was a painful negative 73%. Google, Twitter, and Facebook all passed bans on Bitcoin and cryptocurrency advertisements, with Facebook claiming they were frequently associated with misleading or deceptive promotional practices. Bitcoin closed 2018 at $3,693.
Retail investors who bought near the peak lost most of what they put in. Long-term holders waited. Developers kept building.
2019: A False Dawn, Then Recovery
Bitcoin opened 2019 below $4,000. In April, it jumped from $5,000 to over $8,000 in a matter of weeks, driven partly by excitement around Facebook’s announced Libra stablecoin project. By June it briefly touched $13,000, and many assumed the bear market was over.
It was not quite that simple. The second half of 2019 saw prices drift back down, and the year closed around $7,200. Still, the direction had shifted. The bear market of 2018 was over.

2020: Pandemic, PayPal, and the Institutional Turn
The COVID year began with panic. In March, when stock markets collapsed, Bitcoin fell to around $5,000 alongside every other asset. The correlation with risk assets was brief but striking.
Then something different happened. As governments printed money at unprecedented scale, a growing number of professional investors started treating Bitcoin as protection against currency debasement. Prominent voices like Paul Tudor Jones, MicroStrategy CEO Michael Saylor, and Grayscale Investments called it digital gold, and 2020 proved that Bitcoin had a place in conversations about global finance, even in a crisis.
The third halving arrived in May, cutting the block reward to 6.25 BTC. PayPal announced in October that it would let its 350 million users buy and sell Bitcoin. By December 31, Bitcoin was at $29,000. It had quadrupled in a single year.
2021: Tesla, El Salvador, and $69,000
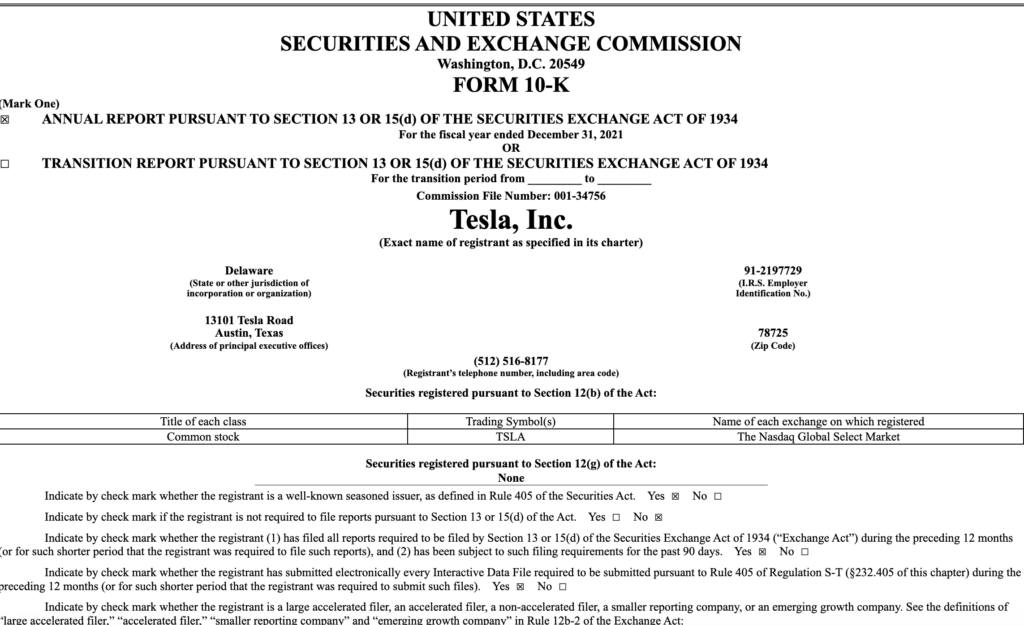
2021 was the year institutions fully arrived. MicroStrategy had already been buying. Tesla announced a $1.5 billion Bitcoin purchase in February and briefly accepted BTC for car payments. Coinbase went public on the Nasdaq. El Salvador made Bitcoin legal tender, the first country in the world to do so.
Bitcoin hit $64,000 in April, pulled back hard, then rallied again. By October, the currency was back over $60,000 and on its way to a new all-time high of $68,789 on November 10, 2021. The year closed near $46,000, still a staggering gain from where 2021 began.
2022: The Year Everything Broke
Few years in financial markets were as destructive as 2022. The Federal Reserve began raising interest rates aggressively to fight inflation, draining liquidity from every speculative asset. Then, in May, the Terra and Luna ecosystem collapsed, wiping out roughly $60 billion in value almost overnight.
The damage spread. Celsius Network froze withdrawals. Three Arrows Capital went bankrupt. In November, FTX, one of the largest crypto exchanges in the world, imploded in a fraud scandal that sent its founder Sam Bankman-Fried to prison. Bitcoin closed the year near $16,500. The decline from its 2021 peak exceeded 75%.
2023: Quiet Accumulation
From the ashes of 2022, Bitcoin spent 2023 rebuilding. By October 2023, BTC rose to $35,200, its highest level since May 2022, driven by optimism over the potential approval of spot Bitcoin ETFs in the US. Over the year, BTC’s price roughly doubled, recovering a significant portion of its earlier losses.
BlackRock’s application for a spot Bitcoin ETF was the story that defined the year. If the world’s largest asset manager was serious about bringing Bitcoin to mainstream investors, the structural demand picture was about to change dramatically.
2024: The Spot ETF Era Begins and Bitcoin Crosses $100,000
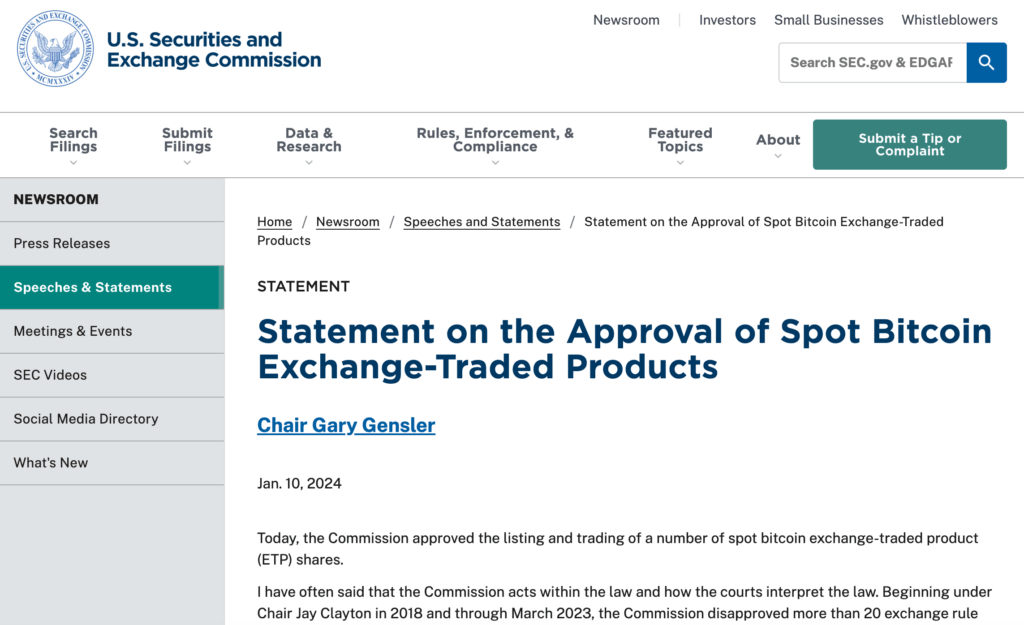
January 11, 2024 changed Bitcoin’s market structure permanently. The SEC approved 11 spot Bitcoin ETF applications from the likes of BlackRock, Fidelity, and others. The launch broke all previously held ETF records, outperforming all other ETF launches by substantial margins.
Within months, ETF assets reached roughly $16 to 21 billion. Capital flowed in rapidly. In March, Bitcoin surged to $73,750.
The fourth halving arrived in April, cutting the block reward to 3.125 BTC. Then came the election. On November 6, 2024, Bitcoin reached a new all-time high of $76,243 once Donald Trump was confirmed to have won the presidential race. On December 5, 2024, Bitcoin crossed the $100,000 line for the first time, reaching $103,679.
The year closed around $93,000. The 100x journey from pandemic lows to six figures was complete.
2025: Strategic Reserves and a New All-Time High at $126,000
2025 opened with Bitcoin already at historic levels, and then kept going. On January 20, 2025, the same day as Trump’s inauguration as the 47th president, Bitcoin reached $109,350.
On March 6, 2025, under the direction of US President Donald Trump, the United States signed an executive order to create a Strategic Bitcoin Reserve for the US Government. The idea that a sovereign nation would treat Bitcoin as a reserve asset would have sounded absurd five years earlier.
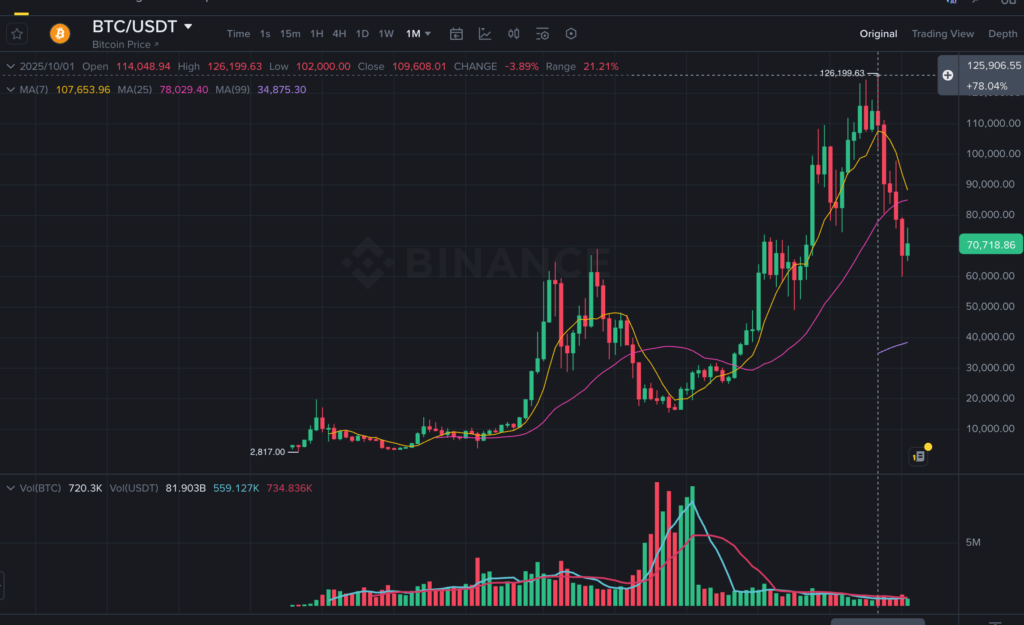
Bitcoin hit an all-time high of $126,000 on October 6, 2025, as ETF inflows returned and institutional optimism held strong. A correction followed through the winter, and Bitcoin entered 2026 trading around $87,000 to $88,000, consolidating after one of its most consequential years.
Bitcoin Halving History and Price Impact
The halving is the single most reliable structural event in Bitcoin’s price history. Every four years, the block reward cuts in half. Every time it has happened, the price has eventually reached a new all-time high within 12 to 18 months.
| Halving | Date | New Block Reward | Post-Halving ATH |
|---|---|---|---|
| 1st | November 2012 | 25 BTC | ~$1,100 (2013) |
| 2nd | July 2016 | 12.5 BTC | ~$20,000 (2017) |
| 3rd | May 2020 | 6.25 BTC | ~$69,000 (2021) |
| 4th | April 2024 | 3.125 BTC | $126,000 (2025) |
The 5th halving is expected in 2028.
Bitcoin Price Summary Table: 2009 to 2026
| Year | Start Price | End Price | Peak | Key Event |
|---|---|---|---|---|
| 2009 | $0 | $0.001 | N/A | Genesis Block |
| 2010 | $0.001 | $0.30 | $0.39 | First pizza trade |
| 2011 | $0.30 | $4.70 | $31 | First $1, Mt.Gox hack |
| 2012 | $5 | $13.50 | $13.50 | 1st Halving |
| 2013 | $13 | $750 | $1,100+ | First $1,000 |
| 2014 | $850 | $320 | $850 | Mt.Gox collapse |
| 2015 | $315 | $430 | $500 | Institutional infra build |
| 2016 | $430 | $960 | $980 | 2nd Halving |
| 2017 | $960 | $14,000 | $19,783 | ICO boom |
| 2018 | $14,000 | $3,693 | $17,000 | Crypto winter |
| 2019 | $3,500 | $7,200 | $13,000 | Facebook Libra |
| 2020 | $7,200 | $29,000 | $29,000 | PayPal, 3rd Halving |
| 2021 | $29,000 | $46,000 | $68,789 | Tesla, El Salvador |
| 2022 | $46,000 | $16,500 | $48,000 | FTX collapse |
| 2023 | $16,500 | $43,000 | $44,000 | ETF anticipation |
| 2024 | $43,000 | $93,000 | $108,135 | Spot ETF, 4th Halving |
| 2025 | $93,000 | ~$87,000 | $126,000 | US Strategic Reserve |
Frequently Asked Questions
What was Bitcoin worth in 2009? Bitcoin had no formal market price in 2009. The first recorded transaction placed its value at roughly $0.001 per coin. It had no exchange rate until 2010.
What is Bitcoin’s all-time high price? As of early 2026, Bitcoin’s all-time high is approximately $126,000, reached on October 6, 2025.
How many times has Bitcoin crashed more than 50%? At least four times in its history: 2011, 2014, 2018, and 2022. Each time, it recovered and went on to set new highs.
Does Bitcoin always go up after a halving? Historically, yes. All four halvings have preceded new all-time highs within roughly 12 to 18 months. However, the timing and magnitude differ each cycle, and past performance does not guarantee future results.
What drives Bitcoin’s price up and down? Supply mechanics, halving cycles, regulatory decisions, institutional adoption, macroeconomic conditions, and market sentiment all play significant roles. No single factor controls the price consistently.
Will Bitcoin reach $1 million? Some long-range models, including those from ARK Invest, project seven-figure Bitcoin prices by 2030. These are speculative forecasts, not guaranteed outcomes.
What the Price History Actually Tells Us
Looking at Bitcoin from 2009 to today, a few patterns stand out clearly.
Every major crash has been followed by a recovery. The Mt. Gox disaster, the 2018 crypto winter, the Terra/Luna collapse, the FTX fraud, each time the price fell more than 70%, and each time it came back. This does not mean it will always happen, but the track record across 15 years is consistent.
The halving cycle is the most reliable clock in crypto markets. Supply gets cut, demand eventually catches up, and prices find new highs. Each cycle has attracted more institutional capital than the last, which has reduced some volatility while increasing the asset’s base of long-term holders.
The market is maturing. The launch of regulated spot ETFs in the US in 2024, followed by a US government executive order to hold Bitcoin as a strategic reserve, represents a structural shift that previous cycles did not have. Whether that reduces future volatility or simply changes its character remains to be seen.
Bitcoin remains volatile, risky, and not suitable for everyone. But the price history, read honestly, tells a story of an asset that has survived every prediction of its death and kept moving forward.
This article is for informational purposes only and does not constitute financial advice. Cryptocurrency investments carry significant risk. Always conduct your own research before making investment decisions.