
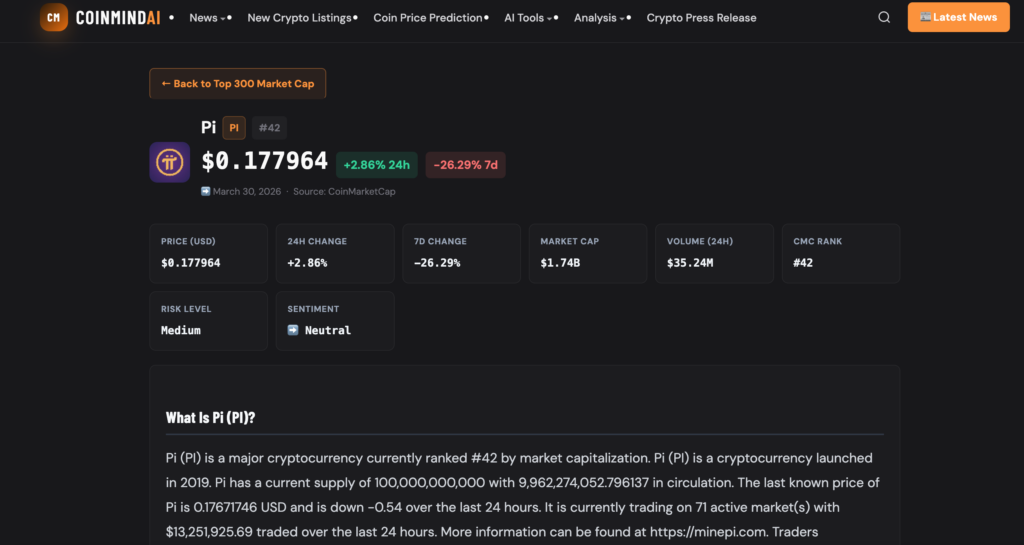
Pi Network (PI) is entering the new week in a fragile technical position. As of March 30, 2026, PI is trading around $0.1766, with a market capitalization near $1.76 billion, 24-hour volume around $13.24 million, and a circulating supply close to 9.96 billion tokens out of a 100 billion maximum supply. Price remains under pressure after failing to sustain earlier recovery attempts, while low volume and weak follow-through continue to limit upside momentum.
For traders and search users asking questions like “Why is Pi Coin down?”, “Can Pi Coin recover?”, and “What is the Pi Coin price prediction for this week?”, the answer is that PI is sitting near a critical support area. Public technical trackers show mixed momentum signals on March 30: Investing.com’s PI technical page shows the 14-day RSI in neutral territory and MACD slightly bearish, while other market coverage notes bulls are still trying to defend the $0.1750 zone.
Pi Coin Price Overview on March 30, 2026
At the start of the week, Pi Coin is trading in a compressed range after a sharp decline from its March spike. Recent market coverage points to a failed rally toward the $0.29 area in mid-March, followed by heavy rejection and a slide back toward $0.17–$0.18. This matters because it gives traders a clear weekly structure: the market is no longer in a breakout phase, but in a recovery-or-breakdown phase.
Why Did Pi Coin Price Drop?
The main reason Pi Coin dropped is that the earlier rally lost momentum and sellers stepped in aggressively after the March surge. Several market reports tie the selloff to fading post-event hype, low liquidity, and renewed deposits to centralized exchanges, all of which increased short-term supply pressure. Broader crypto market weakness has also added pressure to PI’s chart.
In simple terms, Pi did not have enough sustained buying volume to hold its higher levels. Once price slipped below the stronger recovery zone, the market moved back into a defensive structure.
Pi Coin RSI Analysis
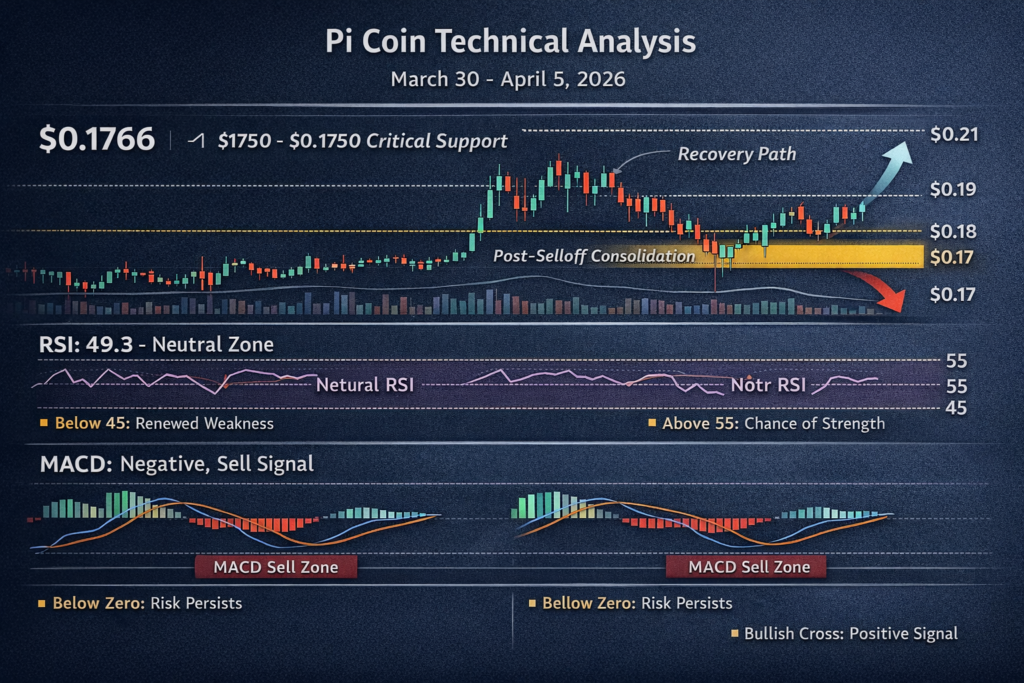
The Relative Strength Index (RSI) is one of the most important indicators for reading short-term momentum. On March 30, publicly available technical data places PI’s 14-day RSI roughly in the neutral zone, around the high-40s to near-50 depending on the feed. That means Pi Coin is not deeply oversold, but it is also not showing strong bullish momentum yet.
For this week, RSI suggests a simple conclusion:
- Below 45 would favor renewed weakness.
- Around 50 keeps Pi in a wait-and-see range.
- A move above 55 would improve the short-term bullish case.
So for March 30 to April 5, RSI does not confirm a strong reversal on its own. It tells traders that Pi is still in a fragile stabilization zone.
Pi Coin MACD Analysis
The MACD reading is also important this week because it helps confirm whether momentum is turning bullish or remaining bearish. Public technical data on March 30 shows PI’s MACD slightly below the stronger bullish threshold, with at least one major technical tracker labeling it as a sell signal. Separate weekly market commentary also says the broader technical outlook remains mixed, with downside pressure still active.
That makes the MACD interpretation straightforward:
- If MACD begins to flatten and cross upward, Pi Coin may attempt a rebound toward nearby resistance.
- If MACD stays negative, the market could retest lower support before any meaningful recovery.
Right now, MACD does not strongly support a breakout scenario for this week.
Pi Coin Fibonacci Levels
Using the recent March swing high near $0.29 and the lower support region near $0.13–$0.17, the key Fibonacci retracement levels place Pi Coin in a technically sensitive zone. Recent chart-based coverage specifically notes that PI lost the 0.618 retracement near $0.23 and the 0.5 retracement near $0.21, while the market is now hovering just above the 0.236 region around $0.17.
That creates the following practical Fibonacci map for this week:
- Immediate support: $0.17
- Lower support: $0.15
- Near resistance: $0.19
- Stronger resistance: $0.21
- Breakout recovery zone: $0.23+
This is one of the most useful takeaways for SEO readers searching “Pi Coin support and resistance levels” or “Pi Coin Fibonacci analysis.”
Pi Coin Support and Resistance Levels for March 30 – April 5
Based on current price structure and recent market commentary, the most important weekly levels are:
Support
- $0.1750
- $0.1700
- $0.1500
Resistance
- $0.1800
- $0.1900
- $0.2100
If PI holds above $0.1750, bulls may try to stabilize price and push it back toward $0.18–$0.19. If that area breaks decisively, the next likely test is closer to $0.15. Multiple recent analyses point to $0.17 as the line that needs to hold to prevent another deeper downside wave.
Pi Coin Weekly Prediction for April 5, 2026
For the week of March 30 to April 5, 2026, Pi Coin looks more like a range-to-bearish setup than a clean bullish reversal.
Bullish scenario
If PI holds the $0.1750–$0.1700 area and momentum improves, price could revisit $0.19 and potentially test $0.21.
Neutral scenario
If volume stays weak and RSI remains near neutral, PI may simply trade sideways between $0.17 and $0.19.
Bearish scenario
If support breaks, sellers could drag PI back toward $0.15, especially if MACD remains negative and exchange-related supply pressure persists. Recent technical reports have highlighted that risk clearly.
Is Pi Coin a Buy This Week?
Pi Coin is not showing a strong momentum-buy setup at the moment. The chart is trying to stabilize, but RSI is neutral and MACD remains weak. That means PI currently looks more suitable for confirmation-based traders than aggressive breakout buyers.
In other words, this week’s chart favors patience. A reclaim of $0.19 would improve sentiment. A break under $0.17 would likely shift attention back to deeper downside risk.
Frequently Asked Questions About Pi Coin
Why is Pi Coin going down?
Pi Coin has been under pressure because the March rally failed to hold, liquidity remains thin, and exchange-related supply has increased. Broader crypto market weakness has also hurt sentiment.
Can Pi Coin recover this week?
Yes, but only if bulls defend the $0.1750 area and price reclaims $0.19. Without that, the chart remains weak.
What is the Pi Coin RSI today?
Public technical trackers on March 30 show PI’s RSI in the neutral range, roughly around the high-40s to near-50 depending on the source.
What is the key Pi Coin support level?
The most important short-term support is around $0.17–$0.175. If that breaks, the next major downside zone is closer to $0.15.
Can Pi Coin reach $1 soon?
Based on its current price near $0.1766, a move to $1 would require a very large revaluation and far stronger momentum, liquidity, and utility than the chart currently shows. At today’s levels, that is not the base case for this week.
Final Verdict
Pi Coin weekly analysis for March 30 to April 5, 2026 suggests that the token is trying to hold a critical support zone, but the broader technical picture is still cautious. RSI is neutral, MACD remains soft, and Fibonacci structure shows that PI is trading close to a key support cluster rather than a confirmed breakout area. Unless bulls reclaim $0.19 quickly, the market may stay range-bound or retest lower levels before a stronger recovery can begin
This content is for informational purposes only and does not constitute investment advice.