
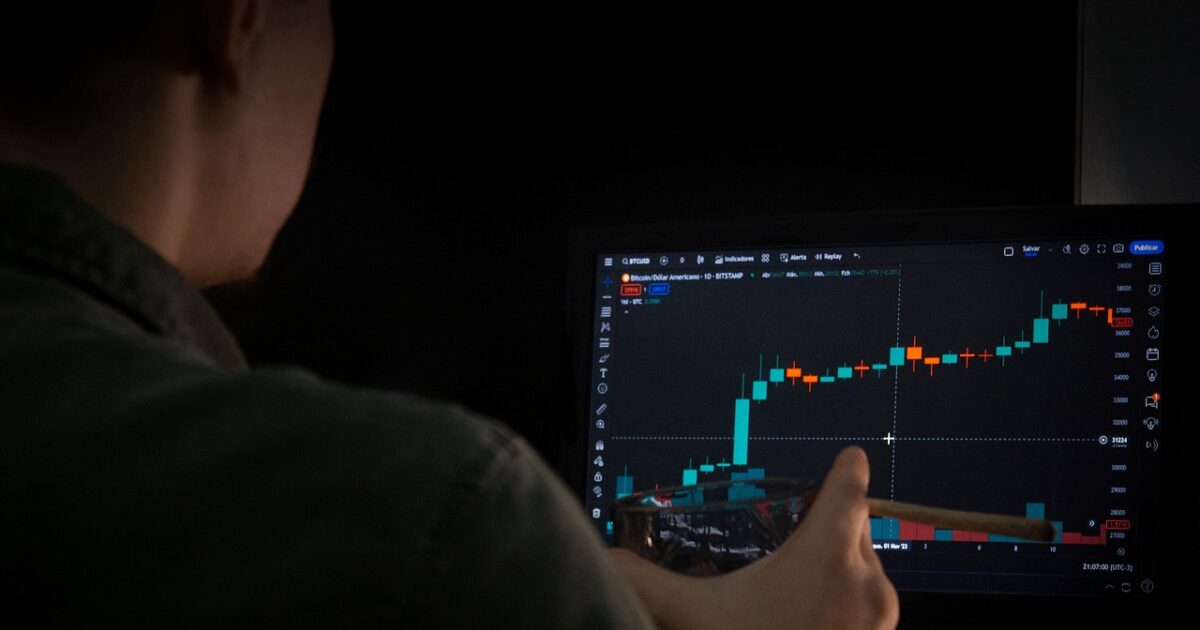
Bitcoin Price Today: March 22, 2026
Bitcoin continues its consolidation phase, trading at $69,136 following a 2.28% decline over the past 24 hours. The world’s largest cryptocurrency maintains a market capitalization of $1.383 trillion despite recent selling pressure that has pushed BTC away from its recent highs.
Trading volume remains robust at $27.5 billion, indicating sustained institutional interest even as price action suggests uncertainty among traders and investors. The current price action places Bitcoin in a critical technical zone where multiple indicators converge to signal potential directional clarity.
Today’s decline comes amid broader market reassessment of risk assets, with Bitcoin demonstrating its continued correlation to traditional finance during periods of uncertainty.
The cryptocurrency’s ability to hold above key technical levels will determine whether this represents a minor correction or the beginning of a deeper retracement.
BTC Technical Analysis: Reading the Signals
Bitcoin’s current position aligns precisely with the 61.8% Fibonacci retracement level from its recent swing high, creating a natural decision point for traders. This golden ratio level often serves as a magnet for price action, and Bitcoin’s reaction here will likely dictate near-term direction.
The Relative Strength Index (RSI) on the daily timeframe sits at 45.2, down from overbought territory earlier this month. This reading suggests selling pressure has eased but momentum remains bearish until RSI can reclaim the 50 midline with conviction.
MACD indicators present a mixed picture with the signal line beginning to flatten after several days of negative divergence. The histogram shows diminishing selling momentum, though a bullish crossover remains elusive.
The 4-hour chart reveals a descending triangle pattern with lower highs since March 18th, while support at $68,800 has held firm through multiple tests. This compression suggests an imminent breakout in either direction.
Key Levels: Support, Resistance & Market Structure
Immediate resistance emerges at $70,500, where the 50% Fibonacci level coincides with previous support turned resistance. A decisive break above this level would target $72,800, representing the 38.2% retracement and a critical threshold for renewed bullish momentum.
Downside support begins at $68,800, marking the recent swing low and the lower bound of the current consolidation range. Below this level, Bitcoin faces a potential decline toward $66,200, where the 78.6% Fibonacci retracement offers the next significant technical floor.
Volume profile analysis reveals a notable gap between $67,000 and $68,000, suggesting any break below current support could accelerate quickly through this zone. Conversely, heavy volume at $71,000 may provide resistance on any recovery attempt.
The weekly chart maintains its uptrend structure, with Bitcoin holding well above the 200-week moving average at $52,400. This longer-term perspective supports the view that current weakness represents consolidation rather than trend reversal.
Macro & Regulatory Backdrop
Federal Reserve Governor Michelle Bowman’s recent comments about maintaining a cautious approach to interest rate policy continue to influence cryptocurrency markets. Her emphasis on data-dependent decisions has kept investors guessing about the timeline for potential rate cuts.
Spot Bitcoin ETF flows have shown mixed patterns this week, with BlackRock’s IBIT experiencing modest outflows while Fidelity’s FBTC attracted fresh capital. These divergent flows reflect the current market uncertainty and institutional portfolio rebalancing ahead of quarter-end.
Regulatory developments in Europe have provided a more supportive backdrop, with the Markets in Crypto-Assets (MiCA) framework offering greater clarity for institutional adoption. This regulatory certainty contrasts with ongoing uncertainty in other jurisdictions.
Bitcoin Outlook: What Should Investors Watch?
The convergence of multiple technical factors at current levels makes the next 48 hours critical for Bitcoin’s near-term trajectory. Traders should monitor whether BTC can maintain support above $68,800 while watching for any increase in buying volume.
Key catalysts to watch include potential Fed communications next week and continued ETF flow data, which has become an important gauge of institutional sentiment. On-chain metrics suggest long-term holders remain patient, with minimal selling pressure from this cohort.
Bitcoin’s correlation with traditional risk assets has increased recently, making broader market sentiment an important factor. Any significant moves in equity markets or changes in dollar strength could influence BTC’s ability to break from its current range.
The cryptocurrency’s performance relative to altcoins also bears watching, as Bitcoin dominance has shown signs of stabilization after recent declines. A shift in this dynamic could signal changing risk appetite within the crypto ecosystem.
Analysis based on CoinGecko market data, Federal Reserve communications, and ETF flow reporting available at publication time.
Editor’s Take: Bitcoin’s dance around the 61.8% Fibonacci level at $69,100 is textbook technical analysis in action. The failure to bounce decisively from this golden ratio support suggests bears maintain control, with a break below $68,800 likely triggering a swift move toward $66,200. Bulls need to see volume expansion above $70,500 to signal any meaningful recovery attempt.
Not Financial Advice: This article is for informational purposes only. Bitcoin investments are highly volatile and carry significant risk. Always do your own research.